Samples of data products and installation
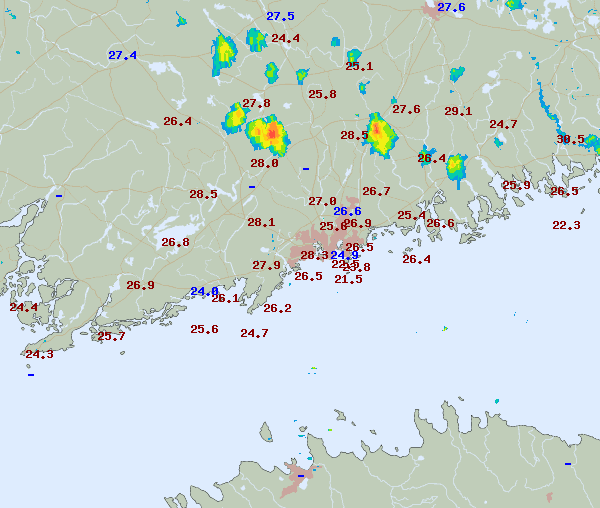
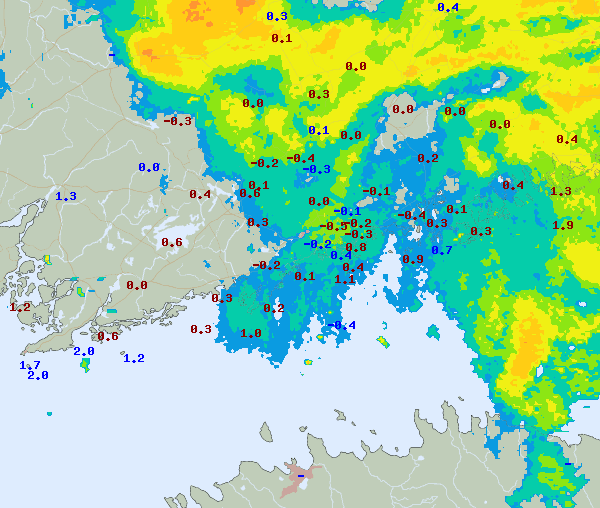
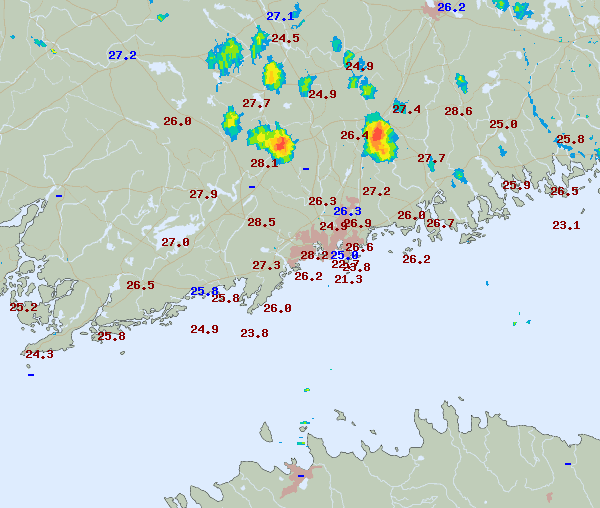
A radar image and temperatures measured with the dense network (red) and FMI normal network (blue) July 5th 2005 5:00 PM. Note the isolated showers in the northern part of the area, and how temperature offshore is cooler than elsewhere.
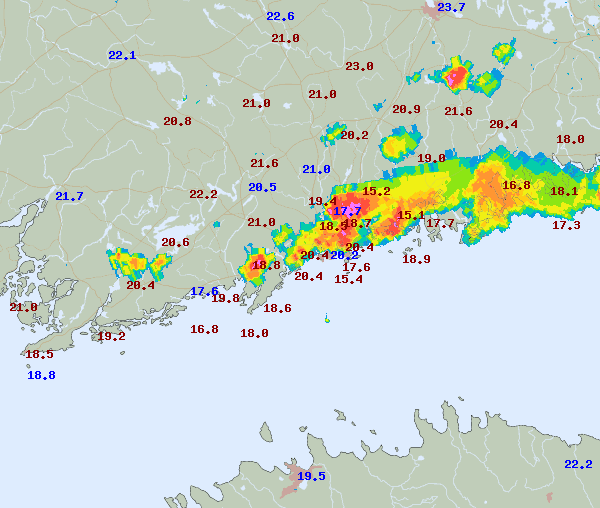
5:15 o'clock image shows how the showers move and develop. At the easternmost station the temperature has fallen 5 degrees in 15 minutes. This is due to a gust front bringing cool air from a larger shower (the shower itself is outside of the picture, but the gust front can be seen as a narrow band in the radar image).
The image above represents temperatures and rain on July 28th 2005 at 18 o'clock. Flooding of underpasses in Vantaa was caused by the heaviest rain that can be seen in the image in pink color. Figure also shows how temperature has declined below 20 Celsius in rainy regions. In the heaviest rain, temperatures have even reached 15 degrees.
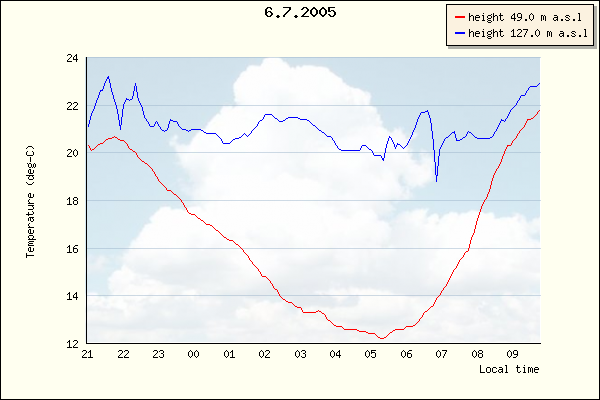
Summer night temperature near surface (red) and at mast top (blue). At the lower station temperature has fallen to +12 C and risen rapidly after the sunrise. At mast top the difference between day and night is much smaller, and the temperature rise starts later. The altitude difference of these two stations corresponds to a skyscraper higher than 20 floors.
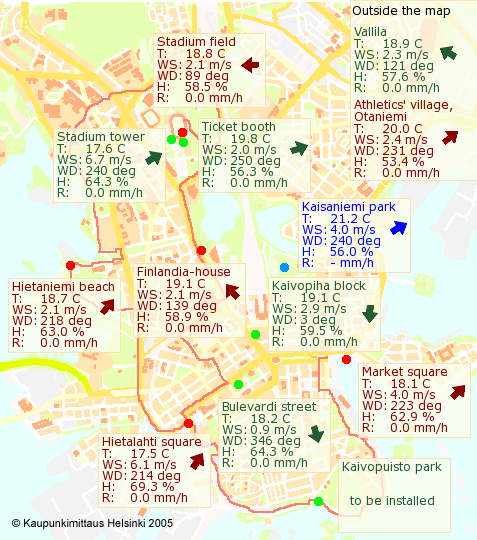
Observations from stations in urban area demonstrate how meteorological microscale phenomena can
introduce occasionally major deviations from the prevailing weather. In the example, stations at stadium tower and Hietalahti square get the prevailing southwestern wind (6 m/s). All the others are more or less shielded from this wind direction. Bulevardi street station is inside a courtyard, so it shows very weak winds most of the time. This is true: wind does not blow hard inside city blocks.
If you want to get a view of the general wind field, e.g. for wind surfing activities, look at the Uusimaa picture below city map (Spatial observations). There, the wind arrows represent values measured at telecommunication mast tops, typically 20-70 m above the ground.
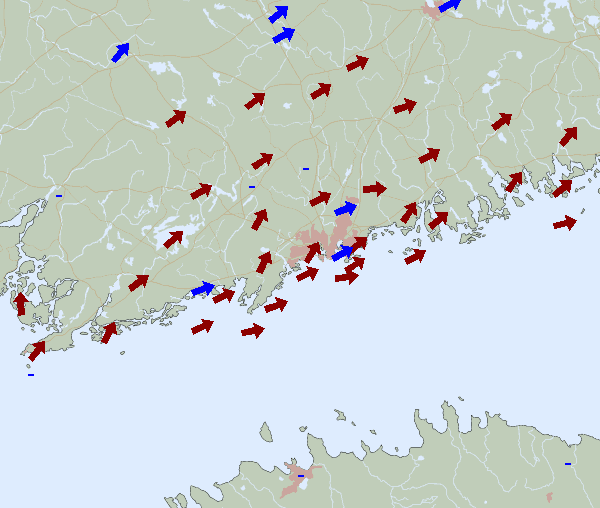
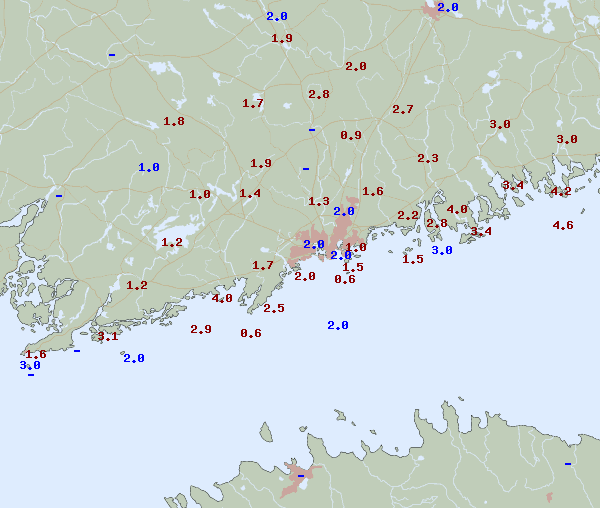
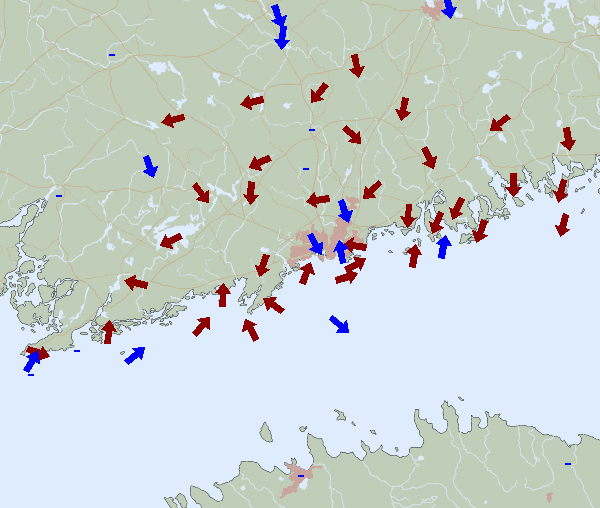
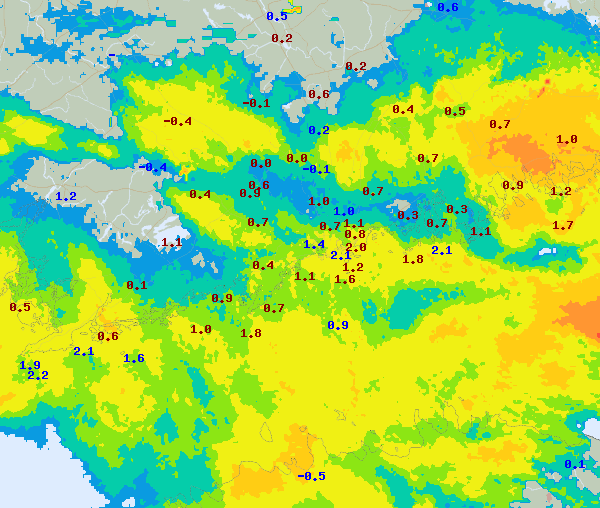
When high pressure field dominates, basic flow is weak and wind direction pattern can be highly non-uniform also in larger areas. This situation is illustrated in the following two images, both at 16:00 o'clock on Sept. 1st 2005. The first shows wind speed (m/s) and the second wind direction (arrows).
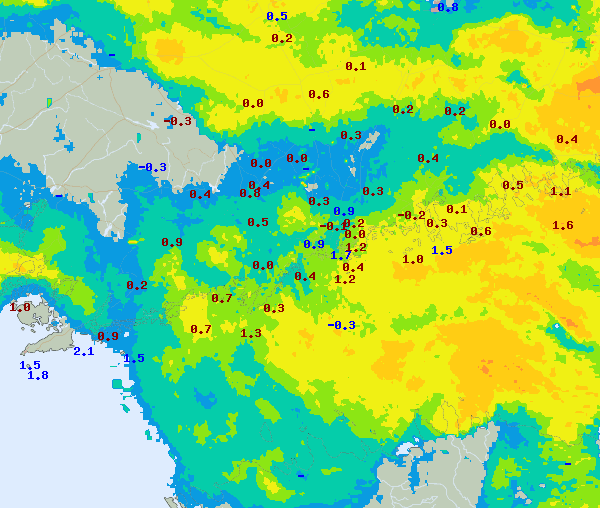
In fall when sea is relatively warm as compared to land surface, long lasting showers may form in the sea. This is illustrated in the following few images on the 20th of November 2005. The first two present conditions at 20:00 local time. Although the basic flow was from north, weak southerly winds existed in the Estonian coast generating land-sea circulation.
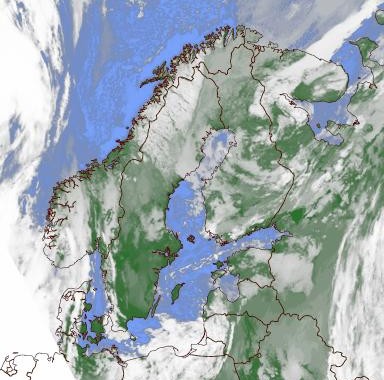
The existence of a cloud line along the Gulf of Finland was clearly seen throughout the day. See the following satellite image at 12:36 o'clock, for instance. At mid-day, temperature differences between finnish land areas and the sea were in the order of 0-3 Centigrades while later at 20:00 o'clock differences were around 1-7 Centigrades.
Friday 25th November the temperature was near freezing point, and all
precipitation types were observed in the Testbed area.

Picture above: Markus Juvonen is installing one of the stations. Temperature and humidity are measured inside a white shield to protect the sensors from sunshine. The shield has vents to let the wind blow through it, and these are pointing down to prevent snow blowing inside the shield.